Dr Pavanee Annasawmy, from the LEMAR lab at the University of Western Brittany, participated to the RESILIENCE oceanographic cruise. On board of the research vessel Marion Dufresne with 50 international scientists in April and May 2022, she studied the interactions between ocean physics and biology at small scale (10km) on the edge of eddies in the Mozambique Channel and on the east coast of South Africa. She tells us more about her work on board and her upcoming plans now that she returned in the lab.
In your project presentation, you mentioned that your main plan regarding the cruise was to collect acoustic data. How did it go?
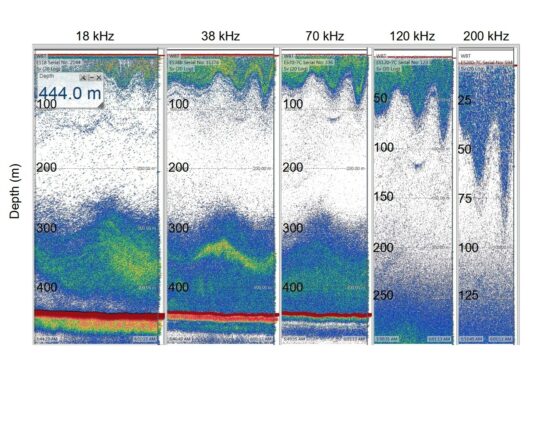
Pavanee: The acoustic data were successfully collected with the shipboard EK80 echosounder operating at 5 frequencies (18, 38, 70, 120 and 200 kHz). The EK80 recorded data continuously from the start to the end of the RESILIENCE cruise.
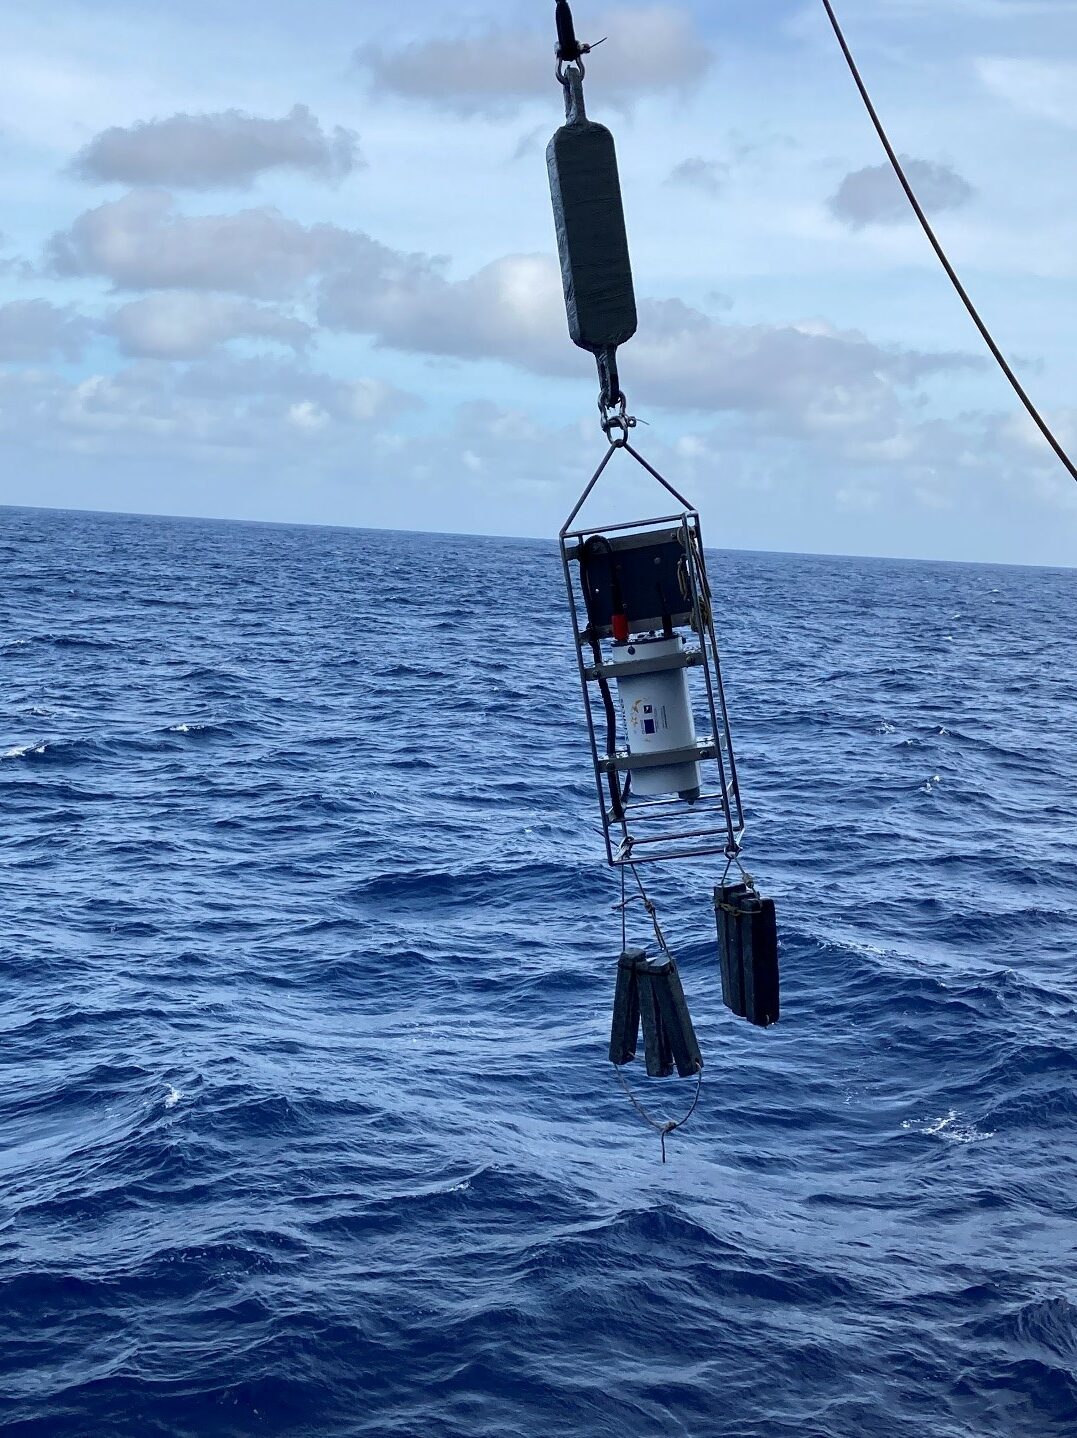
A total of 37 discrete profiles were conducted with an AZFP (Acoustic Zooplankton and Fish Profiler) acoustic echosounder from the surface to 500 m depth. The AZFP was deployed on the side of the research vessel or it was fixed on a CTD (Conductivity Temperature Depth) rosette. The AZFP has operating frequencies of 200, 455, 769 and 2000 kHz, i.e., it allows the detection of size classes of organisms different from the EK80. A UVP5 (device recording plankton images) was deployed in the same location as the AZFP. This will allow the comparison of the acoustic backscatter with the plankton images.
What other type of data did you collect?
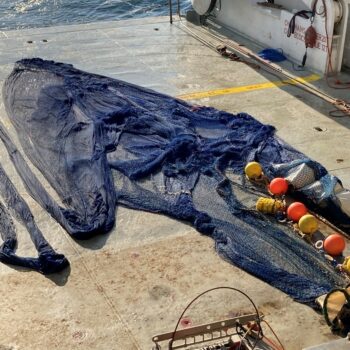
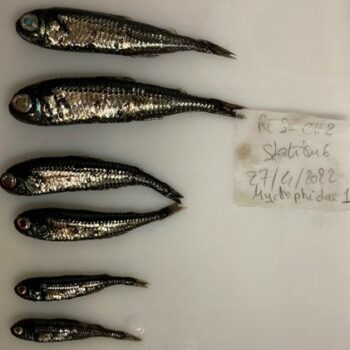
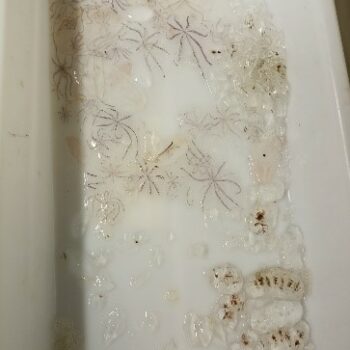
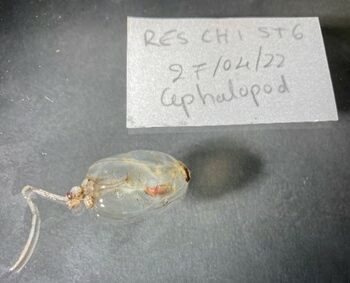
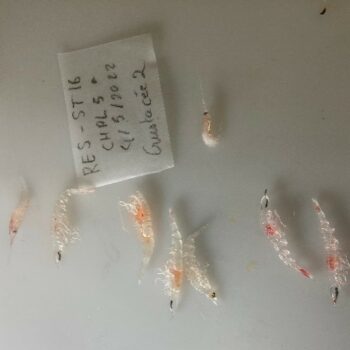
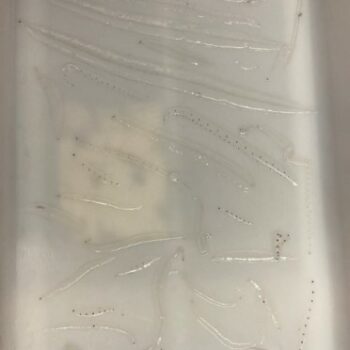
Additionally, 12 mesopelagic trawls were conducted at night to a maximum depth of 100 m to investigate the micronekton organisms observed with the acoustic data. A total of 4 trawls were conducted during Leg 1 (one of the sampling sites) within frontal features in the Mozambique Channel, and the remainder during Leg 2 at various locations within a cyclonic eddy south of Durban.
Unfortunately, the WBAT (WideBand Autonomous Transceiver) which was embarked on the vessel did not function due to technical difficulties inherent to the sensor itself. The WBAT would have allowed detection of single targets during the times and at locations of the trawl surveys. While the WBAT would have provided interesting data on single targets, its malfunction did not impede the overall success of the cruise and the acoustic data collection. My research project targets and objectives will still be met using the other acoustic datasets.
Did you learn something unexpected during the cruise?
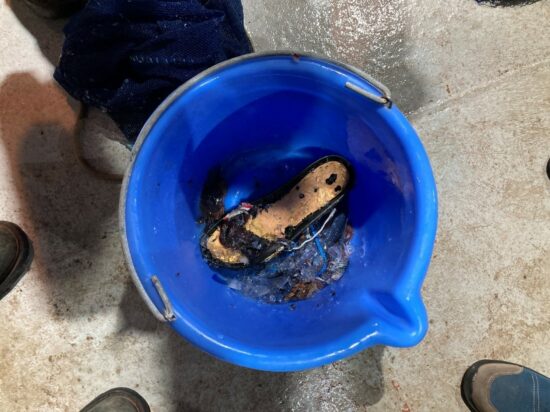
A rather significant unexpected observation during the cruise was the collection of macro-plastic pieces in the mesopelagic trawl. Most of the plastics seem to be of domestic origin, with alimentary plastic wrappers being the most common across all 12 trawl surveys. In the first trawl survey, a female sandal was even collected (see photo). This trawl was conducted in the middle of the Mozambique Channel, which is at its narrowest point about 419 km. It gives you an idea of the long-distance transport of macro-plastics from shore. Within the Durban cyclonic eddy, similar macro-plastic parts e.g., cocktail stirrer parts were collected in three different trawls on consecutive days.
What are the next steps now that you returned to the lab?
Data collected from the EK80, AZFP, UVP and trawl will allow investigation of the zooplankton and micronekton distributions with respect to the life cycle of the Durban cyclonic eddy. The Durban eddy is a semi-permanent cyclonic cold-core frontal eddy located at the southern extent of the KwaZulu Natal Bight, off Durban (South Africa). The acoustic data will also allow investigation of the displacement of various groups of organisms by internal solitary waves.
The immediate next steps I will be involved in are the acoustic data processing to remove unwanted signals, data echo-integration (to convert the acoustic signal to biomass proxies), data analysis and classification of the acoustic backscatter into acoustic groups representing different organisms. I will then analyse the acoustic data with respect to the environmental data (currents, temperature, salinity, dissolved oxygen and chlorophyll). The organisms collected from the trawl surveys will be identified by taxonomists at Reunion Island. The UVP5 images will be processed at the Nelson Mandela University in South Africa.
During the cruise, further collaborations were developed with researchers from the Université de la Réunion. Environmental DNA samples were collected from the Mesopelagic trawl collector and from the Niskin bottles of the CTD rosette to fuel my next postdoctoral research project which will investigate the species and abundance of micronekton in the water column by comparing three different sampling methodologies – eDNA, trawling and active acoustics.
The macro-plastics opportunistically collected in the trawl net will also be measured and Fourier transform infrared (FT-IR) spectrometry analysis will be conducted to indicate the relative proportions of the different polymers. The macro-plastic abundance will be investigated in relation to the physical oceanographic features. I will hence try to exploit this unexpected observation within my research project.
Thank you Pavanee!
photo credit: Dr Pavanee Annasawmy